Semantic Table Interpretation
This page provides a detailed explanation of the Semantic Table Interpretation (STI) process. You'll learn about the steps involved in annotating relational tables using knowledge graphs, including column type annotation (CTA), cell entity annotation (CEA), and column property annotation (CPA)
The Importance of Tables in Information Management
Tables are crucial for creating, organizing, and sharing information. Dating back to 2500 BC, Merer, an Egyptian naval inspector, documented his activities in a table on papyrus. Today, tables are widely used in business, science, and the web, especially with the rise of the Open Data movement
Some key statistics:
- Web Tables: In 2008, 14.1 billion HTML tables were extracted, with 154 million high-quality ones. The Common Crawl 2015 repository has 233 million content tables
- Wikipedia Tables The 2022 English Wikipedia snapshot includes 2,803,424 tables from 21,149,260 articles
- Spreadsheets Between 750 million and 2 billion people use Google Sheets or Microsoft Excel globally
Understanding tabular data can be challenging, even with headers
The role of Knowledge Graph
Knowledge Graphs (KGs) represent relationships between entities (e.g., people, places, events) in graph structures. They use RDF (Resource Description Framework) to encode data meaningfully, facilitating data integration from various formats. Ontologies in RDF specify the meanings of types and properties through logical axioms
Developing KGs enhances data integration and enriches data. Semantic Table Interpretation (STI) is essential for constructing and extending KGs from semi-structured data, attracting significant attention in fields like Semantic Web, Data Management, AI, and NLP
Semantic Table Interpretation
We define Semantic Table Interpretation (STI) as follows:
- A relational table T
- A Knowledge Graph (KG) including entities, statements, and an ontology of types and properties
| Name | Coordinates | Height | Range |
|---|---|---|---|
| Le Mount Blanc | 45° 49' 57" N, 06° 51' 52" E | 4808 | M Blanc massif |
| Hohtälli | 45° 59' 20" N, 07° 48' 10" E | 3275 | Pennine Alps |
| Monte Cervino | 45° 58' 35" N, 07° 39' 31" E | 4478 | Pennine Alps |
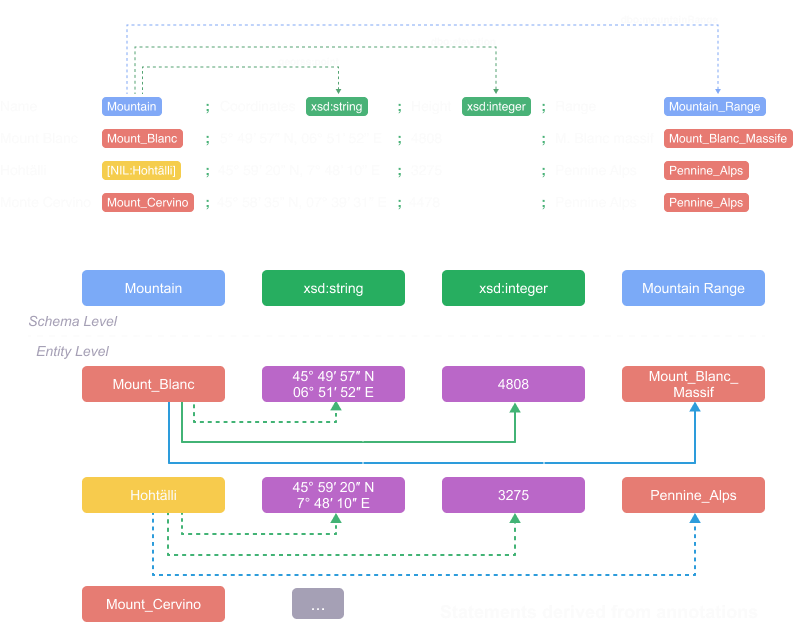
A table T is annotated when:
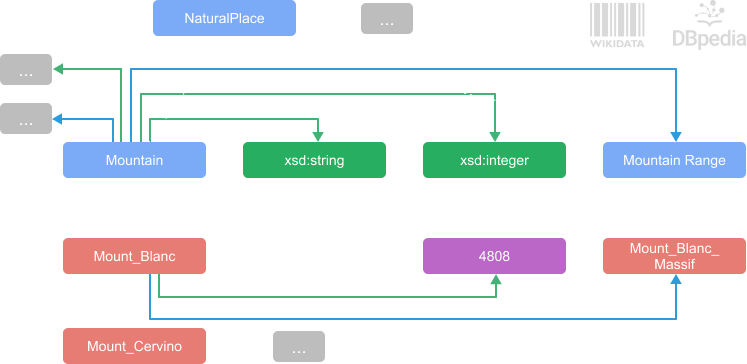
- Each column is associated with one or more KG types
- Each cell in "entity columns" is annotated with a KG entity or marked as NIL if it doesn't exist in the KG
- Pairs of columns are annotated with a binary KG property
The result of the annotation can be visualised in the figure below